
The Housing Panic Is Back. The Data Still Says Something Very Different


Earlier this year, I noticed a small jump in foreclosure filings in my own area. For a moment it felt like something was shifting. Then many of those filings vanished. They were withdrawn, cured, modified, or resolved before becoming actual foreclosures. That made me pay closer attention, because national headlines insisted the opposite. Recent articles talked about spikes and surges, as if the market were ready to fall apart.
The message was clear. Trouble is here. Housing is next.
It sounded convincing, but the facts do not support it. The United States enters this decade with a significant shortage of homes, not a surplus. Filings have risen, but the completion rate is very low, and the pressure is mostly local. The national structure looks nothing like the last cycle.
Here is the full picture.
The National Shortage Model That Frames Everything
The starting shortage is roughly 3.8 million homes. To understand how this evolves, it helps to model three building paths:
Weak build: 1.2 million completions per year
Base build: 1.5 million completions per year
High build: 1.8 million completions per year
Housing demand is not driven only by population. It is shaped by household formation, obsolescence, and the rise in solo living. Together these forces create a requirement of about 1.25 million new homes per year just to keep the shortage from growing.
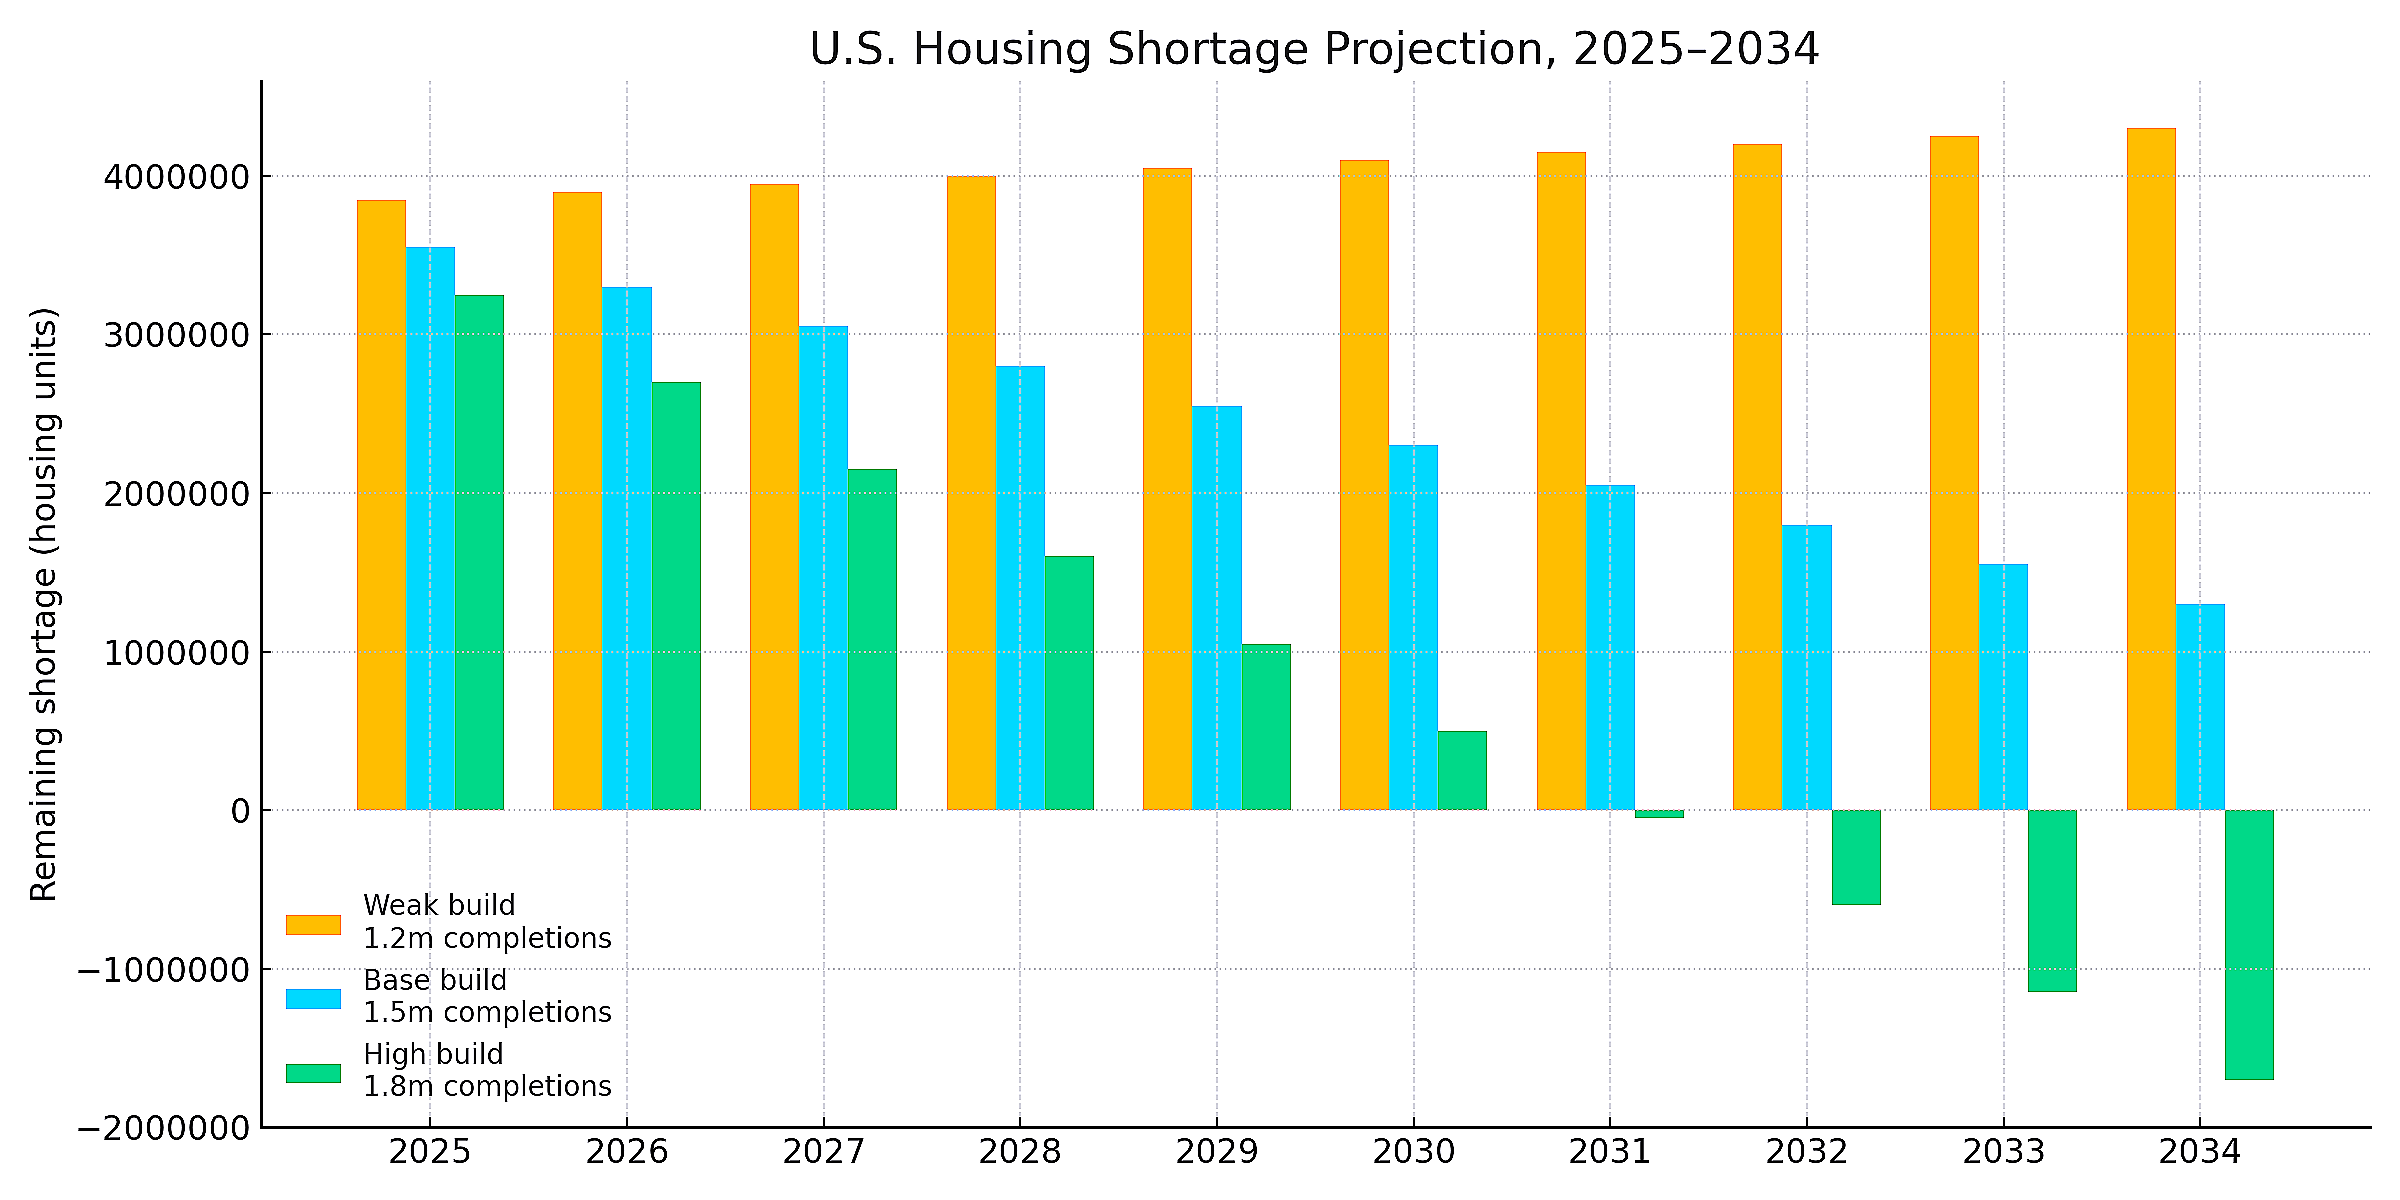
Key takeaway:
None of the typical building scenarios create a surplus. The shortage only flips to surplus under the high build path, and only after eight to ten years of sustained construction.
Side note: The early 2000s crash happened because the country built too many homes. Today the country builds too few.
Where the Required Units Number Comes From
Below is a clear breakdown of the forces that create the baseline of 1.25 million required homes each year.
Annual Required Housing Units Breakdown
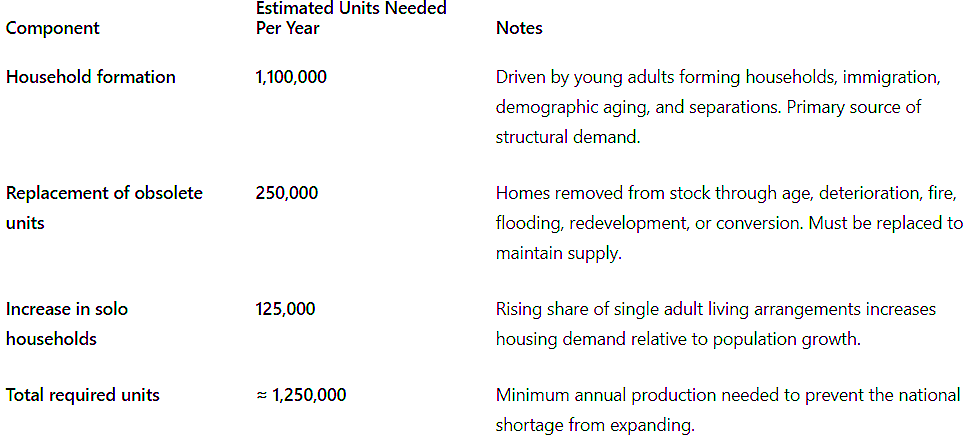
Explanation:
Household formation adds roughly one point one million units of demand each year. About a quarter million homes exit the stock annually due to age or damage. Rising solo living increases the number of units needed even when population growth slows. Together these forces set the baseline requirement for new production.
Why People Expect Housing To Crack First
When the economy weakens, people look to housing first. The last crisis created a lasting reflex: weak economy equals falling home prices. That reflex is understandable, but the structure of today’s market is different.
There is no national overbuilding. Lending standards have been tight for more than a decade. Most homeowners have fixed, low mortgage rates. Inventory is tight. Rental markets are tight. Builders face labor shortages, financing limits, and zoning obstacles. Investor activity is more disciplined.
Key takeaway:
The expectation of another crash comes from memory, not from current fundamentals.
Foreclosures: What Filings Mean and What They Do Not Mean
Filings have increased in some states, but filings are the first step in a long process. Most filings do not become completed foreclosures. Many borrowers catch up or modify. Others sell. Others resolve the default without reaching auction.
The number that matters is the foreclosure completion rate, because that is the number that adds supply.
0.1 to 0.3 percent: Normal
Around 0.5 percent: Elevated
Around 1 percent: Worth watching
Around 2 percent: Historically linked to real stress
The United States sits far below the levels that create market pressure.
Key takeaway:
A rise in filings without a rise in completed foreclosures does not change national supply conditions.
Side note: Headlines focus on filings because the numbers are larger. Completions are what actually move the market.
The Forgotten Risk Group: Low-Rate Borrowers Who Bought at Peak Prices
There is one more group worth examining. Millions of borrowers locked in mortgage rates during the pandemic that will probably never return. Most of this cohort is extremely insulated because their monthly payments are fixed at unusually low levels. They do not face rate resets or adjustable shocks. But a subset of them bought their homes at the highest prices ever recorded in their metros.
These buyers secured very low rates but paid very elevated prices. Many waived contingencies, covered appraisal gaps, and bid aggressively in conditions shaped by scarcity and migration surges. Their payment risk is low, but their vulnerability comes from income stability. If they lose their job, they cannot easily relocate because reentering the market would require taking on a significantly higher interest rate.
Based on origination patterns, about forty percent of existing mortgages were originated in 2020 and 2021. Roughly half of that group are purchases rather than refinances. This suggests there are about eight to ten million households who bought with very low rates but also very high prices.
If unemployment rises, a portion of this group could face stress. If five to seven percent of them experience job loss, that creates about four hundred thousand to seven hundred thousand households under pressure. Only a fraction of these households became delinquent, and only a portion of those move to foreclosure. Historically only about fifteen to twenty five percent of serious delinquencies become completed foreclosures in stable markets. In a conservative scenario, that could mean sixty thousand to one hundred fifty thousand completed foreclosures.
In national terms, that equates to about 0.12% to 0.3% of mortgage holders. National stress levels begin around one percent. Historically dangerous levels begin around two percent. This group would need to experience job loss at rates far above typical recessions to produce systemic supply pressure.
Key takeaway:
The vulnerable segment of low-rate peak price buyers is real, but it is not large enough to create a national supply wave unless unemployment becomes unusually severe.
This risk is more local than national. These borrowers are heavily concentrated in metros where prices surged most during the pandemic, such as Austin, Phoenix, Boise, Tampa, Denver, Salt Lake City, and Nashville. Local stress can occur, but the national market remains anchored by structural shortage.
Solo Households Are a Quiet Demand Multiplier
One of the most important demographic trends shaping the next decade is the rise of solo households. More Americans of all ages are living alone. This increases demand relative to population size.
Two adults sharing a home need one unit.
Two adults living alone need two.
Key takeaway:
Solo living increases housing demand even when population growth slows.
Side note: This trend pushes the required unit numbers higher and makes oversupply harder to achieve.
Rental Pressure Prevents Oversupply
Rental markets remain tight. Rents are elevated and vacancies are low. Even with strong multifamily construction, the country is short of rental units, especially at lower price points.
This acts as a stabilizer. When rents rise or remain high, renters move toward homeownership sooner. That prevents excess for-sale inventory from accumulating.
Key takeaway:
A national oversupply requires both rental and ownership markets to loosen together. There is no evidence of that today.
A Downturn Will Not Resemble the Last One
Even if the economy slows, the ingredients for a housing-driven collapse are not present. Those ingredients include:
National oversupply
Widespread risky lending
High leverage
Adjustable-rate resets
Forced selling
Weak rental demand
None of these describe today’s conditions.
Key takeaway:
Housing can cool during a recession, but it does not collapse without forced supply.
Where Real Local Risk Exists
Some metros have supply pipelines large enough to produce temporary oversupply, especially if migration slows. These include:
Austin
Phoenix
Tampa
Las Vegas
Raleigh Durham
These pockets are important, but they do not define the national market.
Key takeaway:
Regional stress does not translate into national weakness.
What to watch for and when to worry
There are clear indicators that matter. They are slow to appear, hard to hide, and easy to measure.
1. A sustained rise in completed foreclosures
Not filings. Completions.
2. A jump in inventory across multiple regions
If months of supply rise quickly, something is changing.
3. A weakening rental market
If rents fall sharply and vacancies rise, the absorption cushion softens.
4. A construction boom well above trend
National oversupply requires completions near two million units per year for several years.
5. Job loss among pandemic era peak-price buyers
The most vulnerable group is those who bought at high prices with low rates.
Key takeaway:
You worry only when multiple indicators move together. None of them are flashing today.
Sources and References